

From the first half of the year, we saw a slow real estate market compared to the past few years (especially last year). The third quarter…kept with this trend. In all counties that we focused on, inventory and closed sales are down. While this resulted in higher sales prices, it’s not as significant of a jump as you’d expect…and for most counties. Learn which ones have higher selling homes than others by reading through the rest of this blog post.
CHESTER COUNTY MARKET UPDATE:

We didn’t see anything surprising in the third quarter. Inventory continued to be down compared to 2022 causing an increase in the median sold price. Just to get an idea of the differences, here’s what 2022 looked like:
July: 665 New Listings & 646 Closed Sales (highest differential for the quarter)
August: 586 New Listings & 681 Closed Sales (lowest differential for the quarter)
September : 592 New Listings & 541 Closed Sales
July: $497,843 Median Sold Price (lowest price increase for the quarter)
August: $470,837 Median Sold Price (highest price increase for the quarter)
September: $485,000 Median Sold Price
As you look at these numbers, you can see supply and demand on display! The month with the most inventory had the lower prices. This means we are still in a seller’s market but as you can see the percentages aren’t as high the further into the year we go. That means sellers need to understand there are other factors in play that will have to be considered to ensure you get your home sold.
DELAWARE COUNTY MARKET UPDATE:

As we saw in the second quarter, Delaware County’s real estate market progressed in a very similar fashion to Chester County BUT with one very interesting difference. Let’s see the 2022 numbers and see if you notice the difference:
July: 721 New Listings & 629 Closed Sales (highest differential for the quarter)
August: 612 New Listings & 702 Closed Sales (lowest differential for the quarter)
September : 656 New Listings & 566 Closed Sales
July: $330,000 Median Sold Price
August: $334,500 Median Sold Price (lowest price increase for the quarter)
September: $324,750 Median Sold Price (highest price increase for the quarter)
Did you catch it? In Chester County, supply and demand was an immediate correlation to the market trends but not so in Delaware County. Even though August saw the lowest increase in inventory, it was also the lowest price increase. In addition, the highest increase in inventory didn’t see the highest price increase for the quarter. So what is the reason for this difference? The answer has to do with the time of year. Spring and summer are typically the most active times of the year for selling homes BUT in 2022 we saw a VERY strong fall market. And that is why you’re seeing this difference.
So, why does this matter now? It’s a reminder that there’s more to market trends than just supply and demand: loan rates, economic trends, and more can impact how homes buy and sell. This is why it’s so important to team up with local experts who can interpret these trends in real time.
As we transition to another state, we weren’t surprised to see similar trends as our two PA counties. New Jersey shore markets struggled with new listings, saw increase in sold prices (but not by much) and the types of homes that prospective buyers are interested in vary slightly from county to county. Take a look!
CAPE MAY COUNTY MARKET UPDATE

In Cape May, single family homes saw a slightly higher increase in sales price BUT had a 43.2% increase in days on market. When compared to townhouse/condos, we saw a very slight increase in sales price but only 13.7% increase in days on market. Considering that inventory is down overall, these stats imply that right now prospective buyers are looking for townhouse/condos more so than single family homes.
ATLANTIC COUNTY MARKET UPDATE
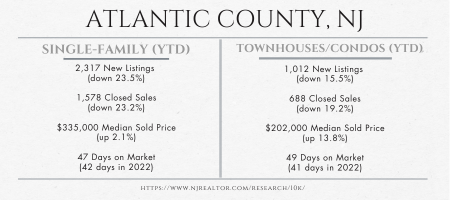
As we saw in the second quarter, prospective buyers in Atlantic County are slightly more focused on townhomes/condos. Inventory and closed sales are down for both resulting in an increase in the median sales prices. Townhouse/condos edge out single family homes in sales price by almost 12% and are only on the market for a slightly longer period of time than single family homes.
OCEAN COUNTY MARKET UPDATE

Ocean County continues to show a stalled market. Inventory and closed sales is significantly lower than in 2022 for both single family & townhouse/condos. And again, we see a VERY slight increase in sales price (5% for single family and 6.8% for townhouse/condos). What did go up was…Days on Market! There was a 33.3% INCREASE for single family homes and 8.3% for townhouse/condos. So if you’re considering selling in this area, be prepared for a longer process - especially with the holiday months coming ahead. This doesn’t mean you can’t sell, it’ll just be a different process compared to those with a stronger seller’s market.
Interesting Development Across These Counties
Anyone looking for retirement homes by the beach? Or thinking of selling yours to move further inland and closer to family? Take a look at what we saw in third quarter for each county - you may be surprised!
CAPE MAY COUNTY
36 New Listings (+12.5%)
29 Closed Sales (7.4%)
45 Days on Market (+200.0%)
$330,000 Median Sales Price (-2.9%)
ATLANTIC COUNTY
232 New Listings (+38.1%)
193 Closed Sales (+39.9%)
51 Days on Market (+64.5%)
$320,800 Median Sales Price (+8.0%)
OCEAN COUNTY
3,011 New Listings (-4.9%)
2,293 Closed Sales (-10.1%)
43 Days on Market (+48.3%)
$285,000 Median Sales Price (+5.6%)
If you’re looking for a 55+ community/retirement home by the beach, you’ll find some great opportunities in this market in most of the shore counties! Selling? There’s interest for it, but you may have to wait a bit before finding the right buyer.
As expected, the real estate market for 2023 is on a slower track. With the holiday months ahead, we don’t expect to see any deviation from these trends. We had suggested at the end of the second quarter to not wait to get homes sold (and bought) as the market wasn’t going to change, other than the process taking longer. We have the same message now. Waiting for 2024 may not be as beneficial as you may think just by looking at these numbers.
With that in mind, if you’ve been wanting to buy and/or sell, talk to our team! We’ll help break down the pros and cons to develop a short- & long-term strategy so you can feel confident in your decision to buy/sell now or later.
Cite: The Pennsylvania statistics all brought to you by Suburban West Realtors Association: https://tcsr.realtor/industry-info-expertise/local-market-statistics/
And The New Jersey statistics from: https://www.njrealtor.com/research/10k/